When FinCalc was first launched in 2020, we advocated that neither deterministic nor stochastic by themselves were the best way to review data.
We previously discussed our preferred 3rd way approach of growth sets, which use deterministic rates but allow the user to enter a different value for each year to build in sequencing and volatility within a “growth set”. For example, the adviser could create a growth set which is averaging 5% per annum over a 10-year period, but year 1 could be -10%, year 2 being +3.5% and so on.
However, since 2020 FinCalc has developed and created a whole host of tools and calculators. We have listened to the market and our loyal users and want to provide a system to cover the whole picture. Therefore, you now have the ability to not only look at linear or variable growth, but also stochastic growth to cover all of your advice needs.
Stochastic modelling can be a very powerful approach to forecast future growth, taking historic data to calculate mean and variances to forecast thousands of random illustrations which creates probable distributions. Due to the scientific nature, it can be difficult to explain how stochastic modelling works and how it has generated the client outputs being discussed. We have taken the approach to build stochastic modelling in two areas of FinCalc as optional extras with easy-to-understand results: the Retirement Modeller tool & Portfolio Projector calculator.
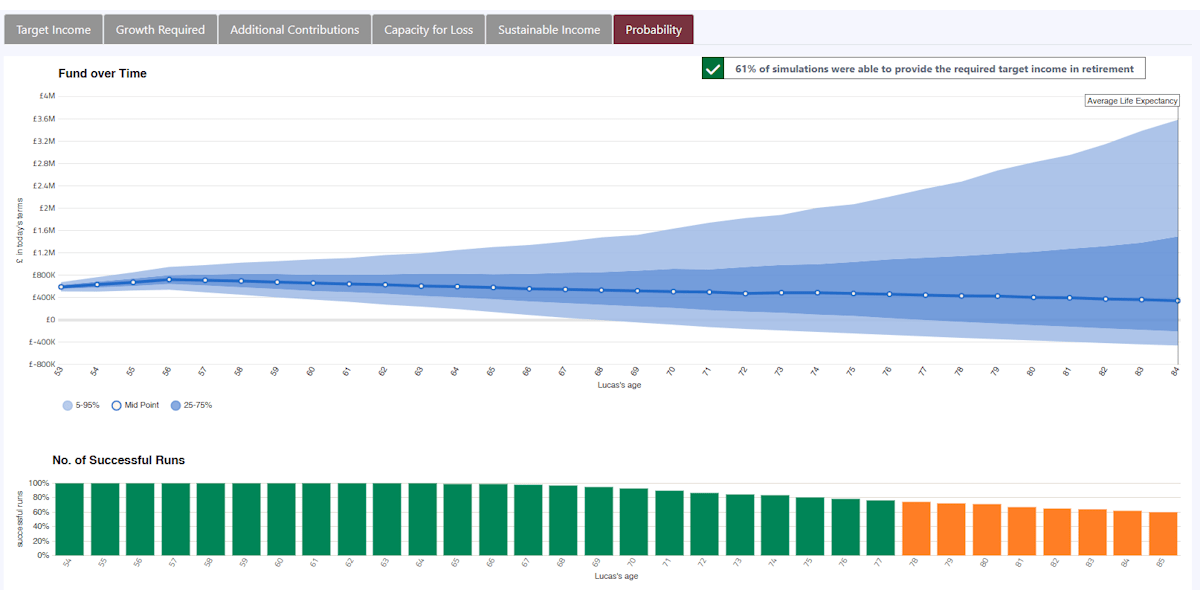
Our Retirement Modeller is a powerful tool which answers common questions of ‘Are my clients on track for their target retirement income?’, ‘How much investment growth do they need to meet their target?’, ‘Do they need to make additional pension contributions?’, ‘What would happen if there was a market crash?’ and ‘What level of income is sustainable for my clients in retirement?’. We have now added the ability to also cover ‘What is the probability of my clients achieving this target income?’.
Adding this additional feature not only allows you to review the data in both a deterministic and a stochastic approach but will also illustrate the volatility of the asset classes selected with the highlighted 5th to 95th percentile range and the 25th to 75th percentile range. This gives the client the whole picture of available outcomes.
The other area stochastic has been added to is within the Portfolio Projector Calculator. This smart calculator has quick and easy inputs with the power to illustrate the accumulation and/or decumulation of any investment or portfolio across a fixed term using either a stochastic or deterministic forecast.
For further details on the improved Retirement Modeller or Portfolio Projector Calculator, please contact us.